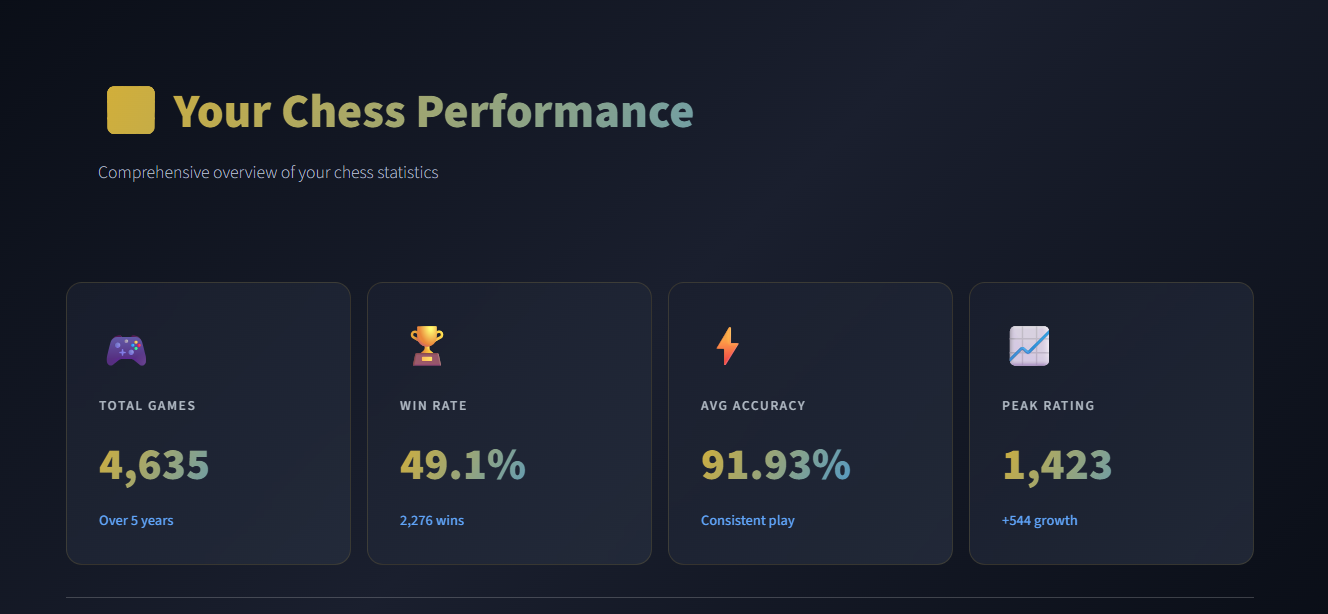
Over five years I accidentally built a dataset: 4,635 Chess.com games. ChessIQ turns that history into an analytics platform — Stockfish-evaluated moves, an outcome predictor built on pre-game features only, and recommendations that actually moved my rating.
I improved my chess rating not by playing more, but by analyzing what I'd already played. Five years on Chess.com left me with 4,635 games — a real, messy, personal dataset. The question: "What if I treated my chess history like an ML problem?" Could a model predict outcomes before a game starts, and could the data tell me exactly what to fix?
Every move was evaluated with Stockfish at depth 15 — 328,258 evaluations — then aggregated into game-level and player-level features for analysis and modeling.
The first model hit 78.21% accuracy — and it was a lie. It used post-game metrics (accuracy %, centipawn loss) as features: numbers you can't know before a game. Classic data leakage. The model was "predicting" outcomes using information from the outcome itself.
The rebuild allowed only pre-game features: my rating, opponent rating, rating difference, cumulative win rate, opponent-rating history, recent streak (last 10 games), time control, and color — 8 features total.
A 5.72-point drop, taken deliberately. Honest > Impressive — the smaller number is the one that works on games that haven't happened yet.
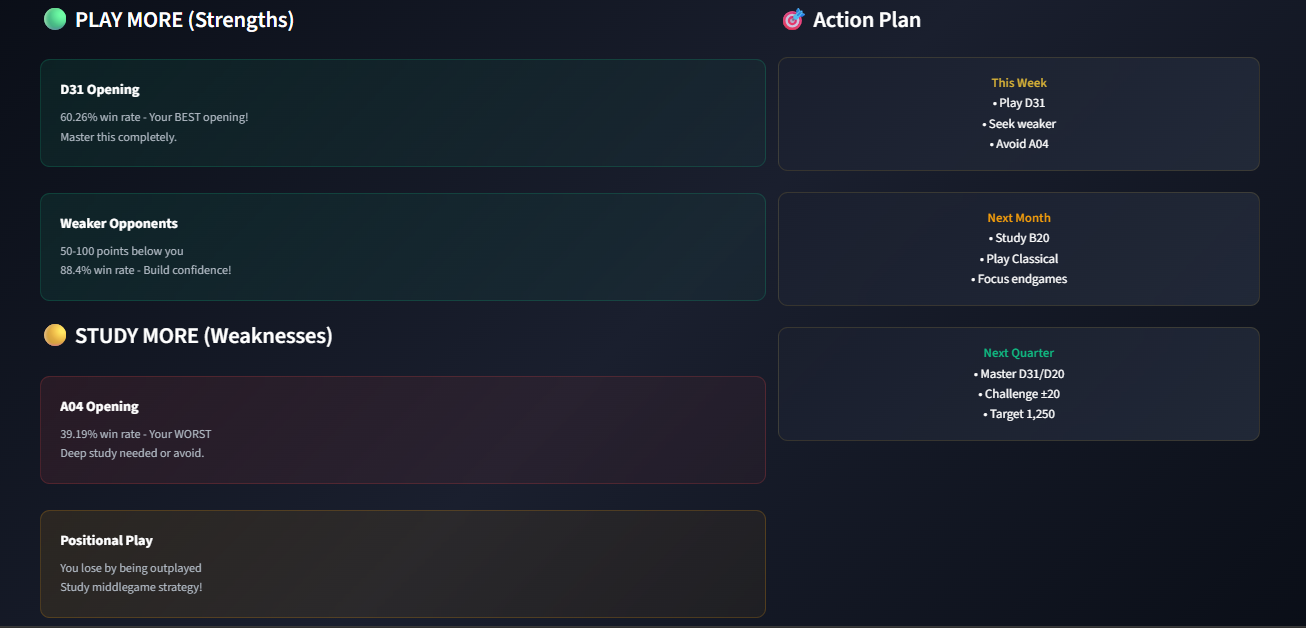
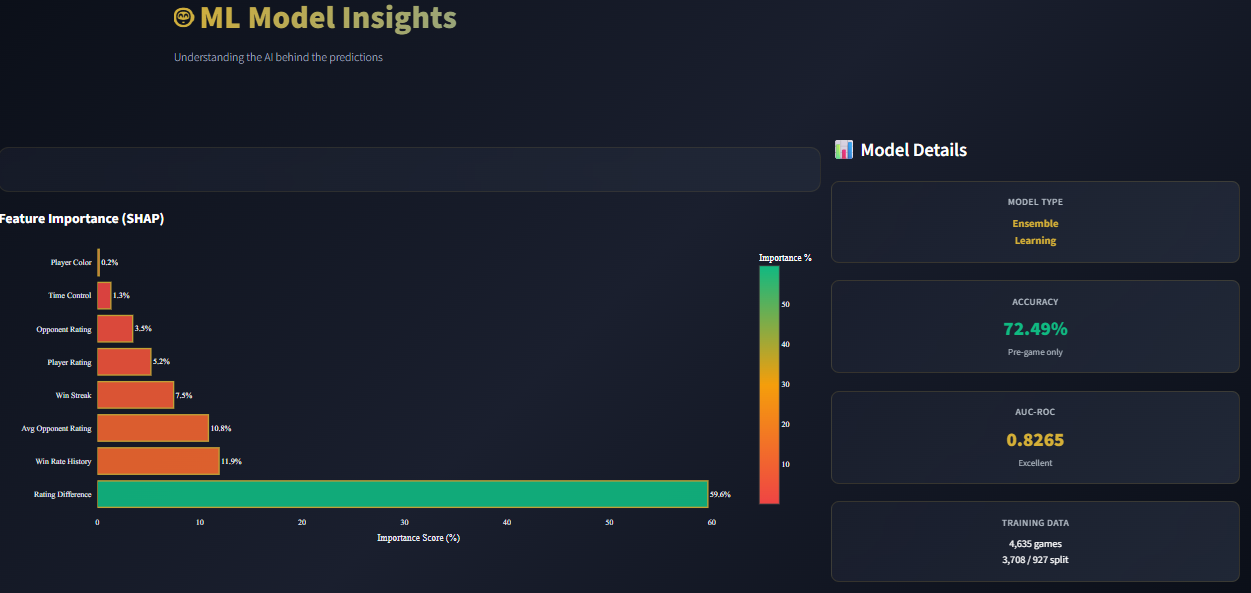
SHAP put rating difference at 59.63% of predictive importance — I beat weaker opponents 88.4% of the time and stronger ones almost never (6.6%). Performance was surprisingly format-agnostic: only 1.8% win-rate variance across blitz, rapid and classical. The biggest lever was openings:
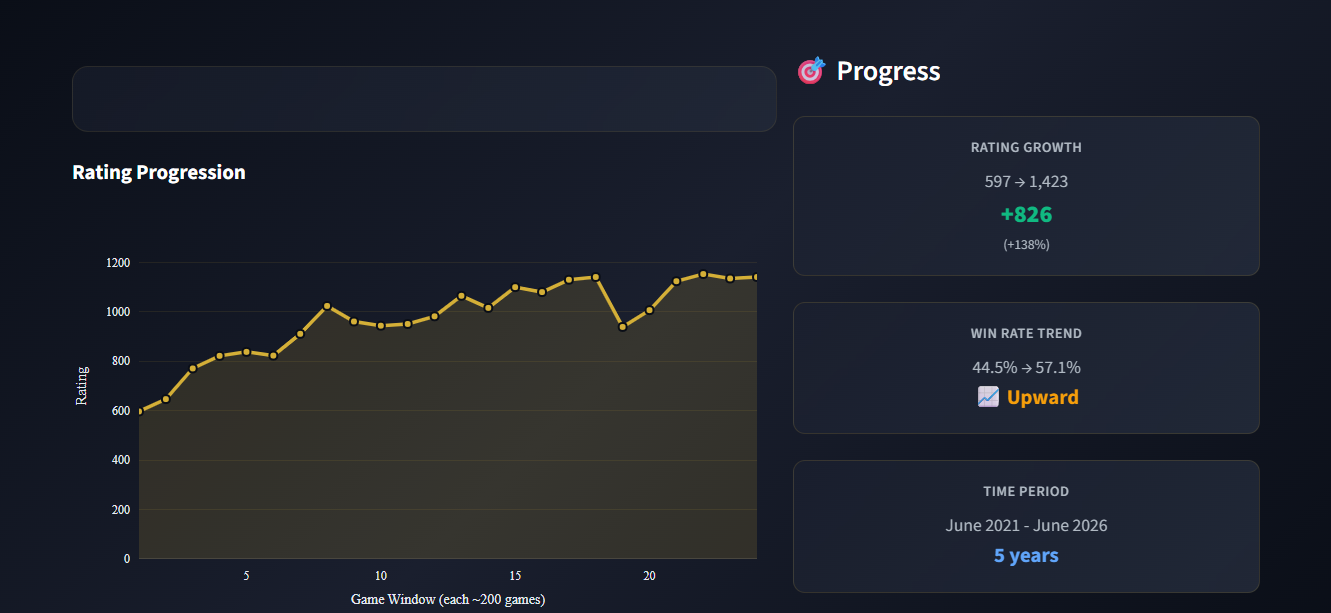
Acting on this — focusing on 2 openings instead of 15 — was worth +150 rating in 6 months, part of the 597 → 1,423 climb. The data also said uncomfortable things: I lose to stronger players by being outplayed positionally, not by blundering. You can't fix what you don't measure.
| MODEL | ACCURACY | NOTES |
|---|---|---|
| Voting Ensemble | 72.49% ★ | selected — best accuracy, stable across folds |
| XGBoost | 72.17% | tuned via GridSearchCV |
| Random Forest | 72.17% | tied with XGBoost |
| Gradient Boosting | 72.06% | — |
| Stacking Ensemble | 71.84% | more complexity, less accuracy |
Validation: 80/20 split, 5-fold cross-validation (74–76% range), McNemar's statistical test between candidates, confusion matrices and ROC analysis. The stacking result is on the page for a reason — fancier isn't better, and showing the losers is what makes the winner credible.
The 72.49% model ships; the 78.21% one doesn't. Fixing leakage taught me more than any accuracy gain would have.
Five model families landed within 0.65 points of each other. The features — not the algorithm — decided the ceiling.
The dashboard told me exactly where I'm weak. Acting on it beat playing a thousand more unexamined games.
The vision: right now ChessIQ analyzes my games. The plan is to let any player upload theirs — personalized analysis, predictions and an improvement plan, for anyone. Next steps on the roadmap: 50K+ multi-player games, move-sequence models (LSTM), and live Chess.com API integration.