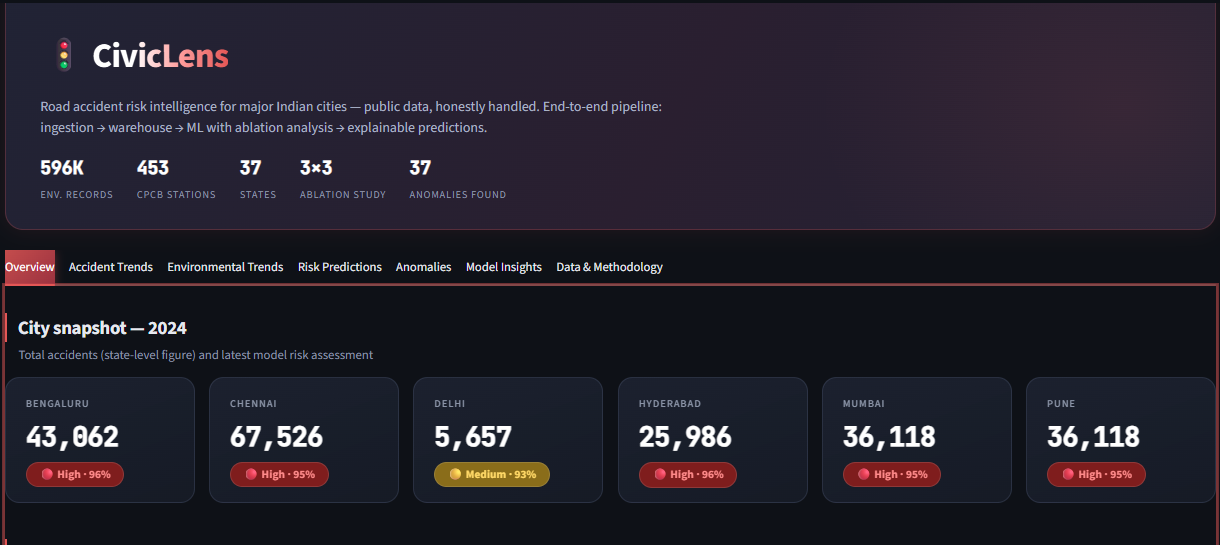
Can public environmental data predict road-accident risk in Indian cities? An end-to-end system — ingestion → warehouse → ablation-tested models → explainable predictions — built to look like production, not a notebook.
India records hundreds of thousands of road accidents every year, and government agencies publish rich open data — CPCB environmental monitoring, MoRTH accident statistics — that mostly sits unused. The question: does environmental data (rainfall, pollution, temperature, wind) carry a real predictive signal for city-level accident risk? And can that be answered with production-grade engineering rather than a one-off notebook?
The honest answer mattered more than an impressive one. Which meant: quality-scored data, leakage-safe validation, an ablation study to isolate where predictive power actually comes from, and per-prediction explainability.
Three public datasets flow through a layered PostgreSQL warehouse into cross-validated models, served by an API and a dashboard — one command to deploy, CI on every push.
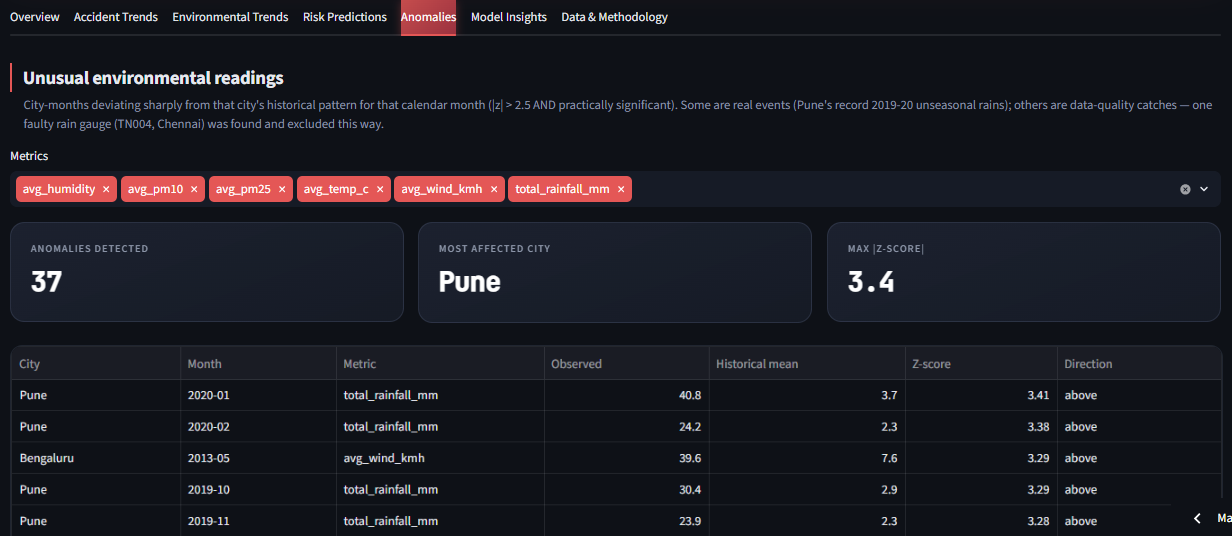
While validating the seasonal anomaly detector (city-months deviating sharply from that city's historical pattern, |z| > 2.5), it flagged Chennai's entire 2019 with 10–20× normal rainfall. One problem: 2019 was Chennai's famous "Day Zero" drought year.
Investigating led to station TN004 — a newly installed CPCB monitor whose faulty rain gauge reported ~20× the city's real annual rainfall for a year, then flatlined to exactly 0.0. A classic sensor failure. It was excluded and documented, and once removed, real events — like Pune's record 2019–20 unseasonal rains — became clearly visible in the data.
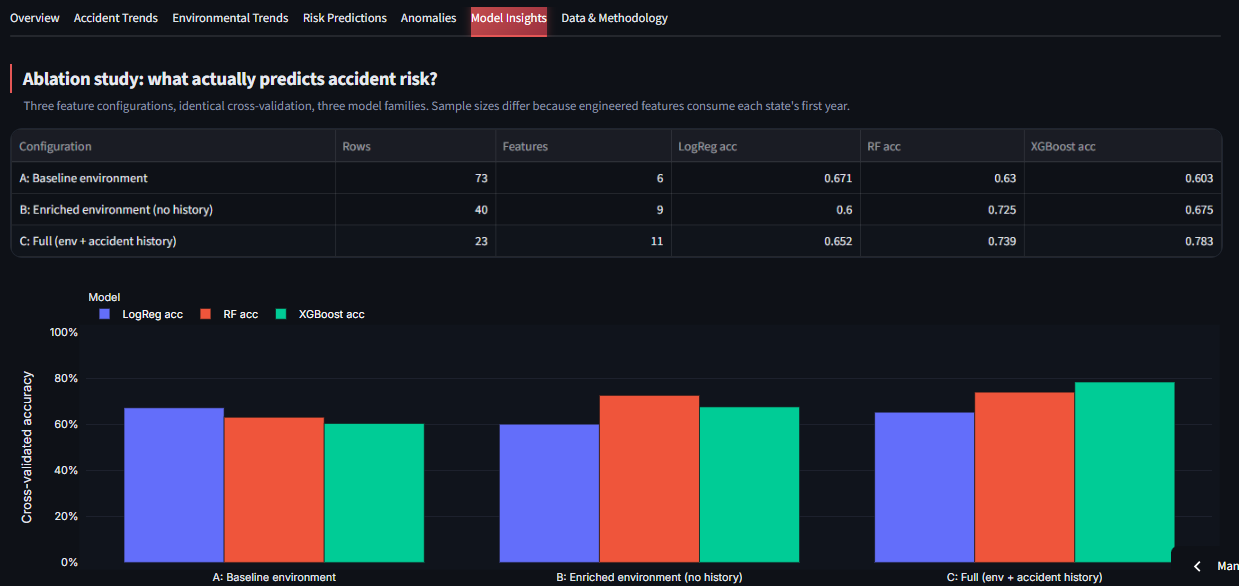
Three feature configurations, identical cross-validation, three model families. The point of the ablation wasn't to maximize a headline number — it was to answer what actually predicts accident risk?
| CONFIGURATION | FEATURES | LOGREG | RF | XGBOOST |
|---|---|---|---|---|
| A · Baseline environment | 6 | 0.671 | 0.630 | 0.603 |
| B · Enriched environment (no history) | 9 | 0.600 | 0.725 | 0.675 |
| C · Full (env + accident history) | 11 | 0.652 | 0.739 | 0.783 ★ |
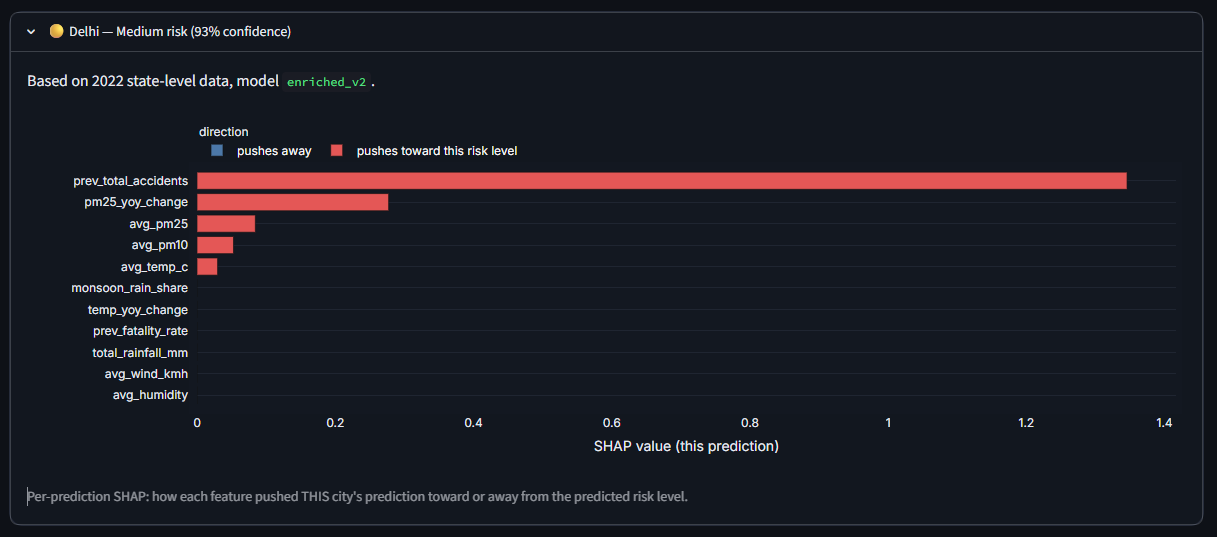
Best model: XGBoost on the full configuration at 78.3% cross-validated accuracy. But the ablation tells the real story: much of that performance comes from accident persistence — environmental conditions carry a real but secondary signal. That insight is worth more than a bigger number.
It's understanding the data and building reliable systems around it — the warehouse, quality scoring and validation took far more engineering than the models did.
The TN004 catch was the moment the pipeline proved it worked — on data quality first, science second.
Reporting 78.3% alone would have been misleading. Showing where the signal comes from — accident history first, environment second — is the finding.