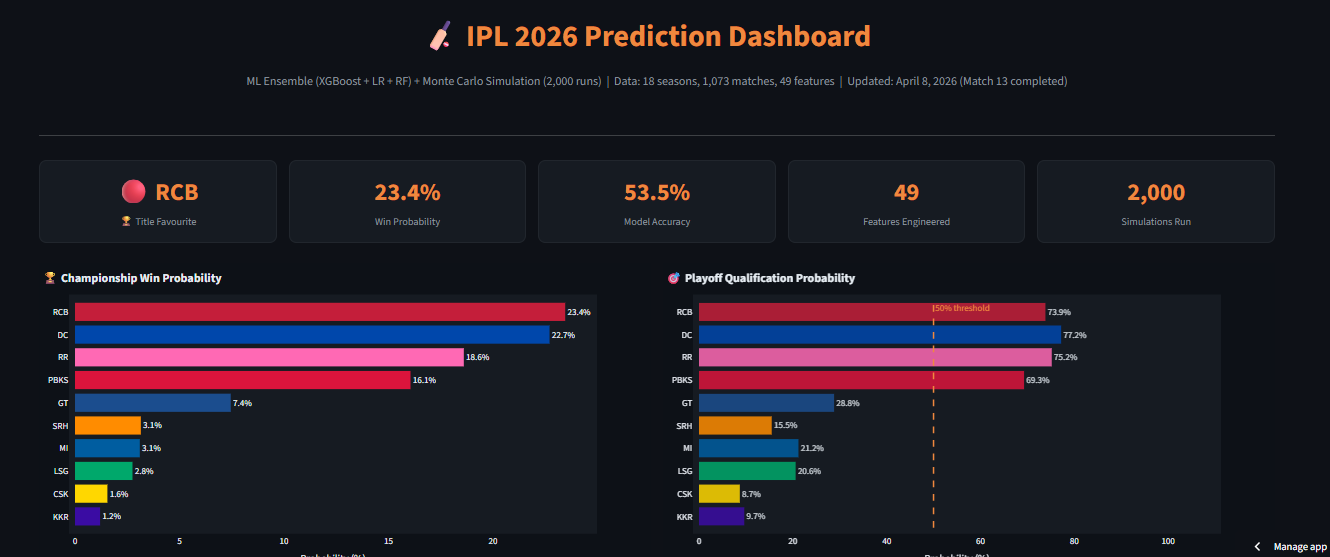
Can you predict a champion in a league famous for chaos? Not with a single answer — but you can model the distribution of possible seasons. An ensemble trained on 18 seasons of ball-by-ball data, run through 2,000 Monte Carlo simulations, gave RCB the top title probability at 25.4%. RCB won.
T20 cricket is one of the most stochastic team sports there is. Match outcomes swing on match-day pitch behavior, dew, dropped catches, and individual brilliance — none of it modelable from history. Published research tops out around 55% match accuracy; even professional betting markets only reach 55–58%.
So the goal was reframed: don't predict a single outcome — model the distribution of possible futures. "RCB wins in 25% of simulated seasons" is a fundamentally more honest and more useful output than "RCB will win."
The model was backtested the only honest way for time-series sports data: train strictly on the past, predict a full unseen future season. Then compared against three baselines — because 54.9% means nothing until you know what naive strategies score.
| SEASON | OUR MODEL | ELO ONLY | HOME FAVORED | RANDOM | LOG LOSS |
|---|---|---|---|---|---|
| 2023 (train 2009–22) | 52.1% | 46.6% | 42.5% | 50.0% | 0.683 |
| 2024 (train 2009–23) | 54.9% | 47.9% | 56.3% | 50.0% | 0.695 |
Worth reading closely: in 2024 the "home favored" baseline actually edged the model on raw accuracy — that's on the page because hiding it would be cherry-picking. The model's value isn't single-match accuracy; it's calibrated probabilities across all matches and teams, which naive baselines can't produce. In a domain this stochastic, a consistent 2–5 point edge over random with good log loss is a real signal.
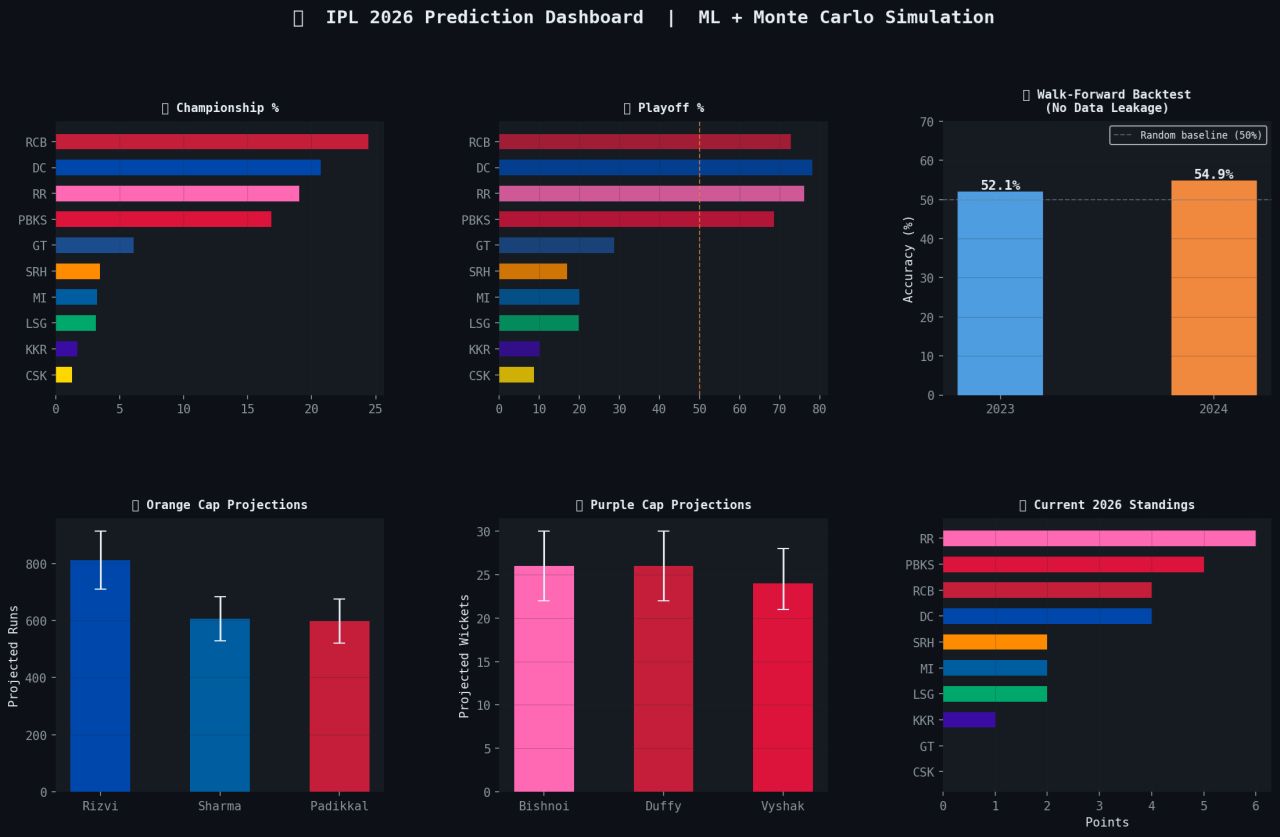
As of match 13, the simulation gave RCB the highest championship probability at 25.4% (DC 21.9%, RR 18.8%), with CSK collapsed to 1.6% — their early-season struggles already priced into the Elo and form features. RCB went on to win IPL 2026.
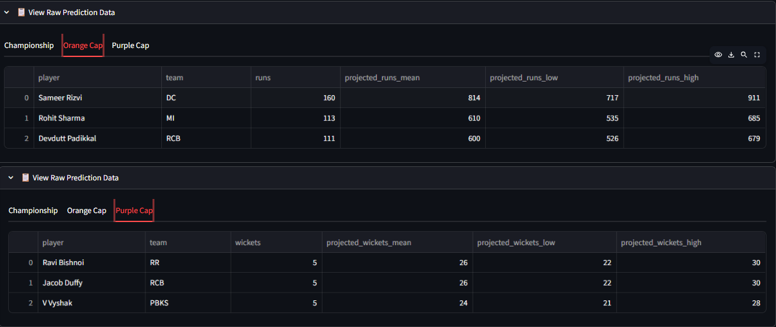
A 25.4% call being "right" deserves honest framing: the model didn't say RCB would win — it said RCB won in a quarter of possible futures, more than anyone else. That's exactly what a calibrated model of an unpredictable league should sound like. Alongside the title race, the simulator projected individual awards with P10–P90 uncertainty ranges:
IPL squads reshuffle every auction. Standard Elo assumes stable teams, so ratings revert 20% toward base each season — teams carry 80% of earned strength forward.
2,000 simulated seasons — including full playoff brackets and per-team injury adjustments — produce a probability distribution instead of a guess.
Raw model outputs are too extreme. Temperature scaling (75% model + 25% prior) keeps the championship distribution realistic across all 10 teams.
Home ground is the single strongest feature (~56% home win rate); powerplay and death-over strike rates outrank overall win rate; GT wins 0% on spin pitches vs 84% on balanced ones.
Roadmap: Bayesian probabilistic modeling, live score ingestion, transformer-based sequence models, and a player-level simulation engine.